POWER BI

Enhancing business experiences with advanced Power BI solutions
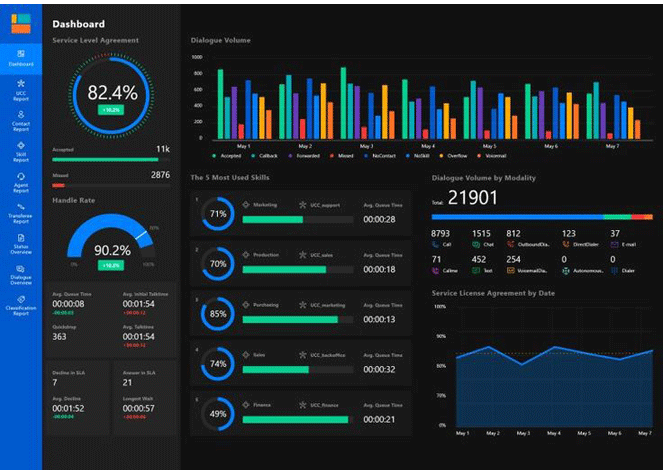
DomainEnroll empowers businesses to gain actionable insights and drive informed decision-making. By leveraging the robust capabilities of Power BI, DomainEnroll transforms raw data into meaningful, interactive visualizations that enable organizations to understand their operations better and identify key trends and opportunities. Our team of experienced professionals works closely with clients to tailor solutions that meet specific business needs, ensuring seamless integration with existing systems and processes. DomainEnroll's holistic approach not only maximizes the value of Power BI but also enhances overall data literacy within organizations, fostering a culture of data-driven decision-making.

What Is Power BI ?

Power BI is a business analytics tool developed by Microsoft that allows users to visualize data and share insights across their organization or embed them in an app or website. With its intuitive interface and robust features, Power BI allows users to connect to multiple data sources, create interactive reports and dashboards, and share insights across the organisation.

Features of Power BI

Data Connectivity
Power BI connects to a wide range of data sources, including Excel spreadsheets, databases, cloud services, and on-premises data. This flexibility allows users to gather data from diverse origins into a unified view.
Data Transformation
Using Power Query, users can clean, transform, and load data. This includes tasks such as filtering rows, removing duplicates, pivoting, and merging data from different sources to create a structured dataset ready for analysis.
Data Modeling
Power BI allows users to create relationships between different data tables, define calculated columns and measures using DAX (Data Analysis Expressions), and build a robust data model that supports complex analytical needs.
Visualization
Power BI offers a rich set of visualizations, including bar charts, line charts, pie charts, maps, and more advanced visuals like waterfalls and funnels. Users can create interactive dashboards and reports that provide deep insights through visual storytelling.

Dashboards and Reports
Users can design reports using Power BI Desktop, combining multiple visualizations on a single canvas. Dashboards are created in the Power BI service, allowing users to pin visualizations from different reports to provide a consolidated view of key metrics.
Sharing and Collaboration
Reports and dashboards can be shared with others within the organization. Power BI's cloud service (Power BI Service) enables collaboration, where team members can view, interact with, and comment on shared reports and dashboards.


AI and Advanced Analytics
Power BI integrates with Azure Machine Learning and other AI services, allowing users to incorporate advanced analytics and predictive modeling into their reports. Features like Q&A (natural language query) let users ask questions in plain language and get answers in the form of visualizations.
Mobile Access
Power BI provides mobile apps for iOS, Android, and Windows devices, ensuring that users can access their data and insights on the go.


Security
Power BI includes features to ensure data security and compliance, such as row-level security, data encryption, and integration with Azure Active Directory for user authentication and permissions management.


WhatsApp